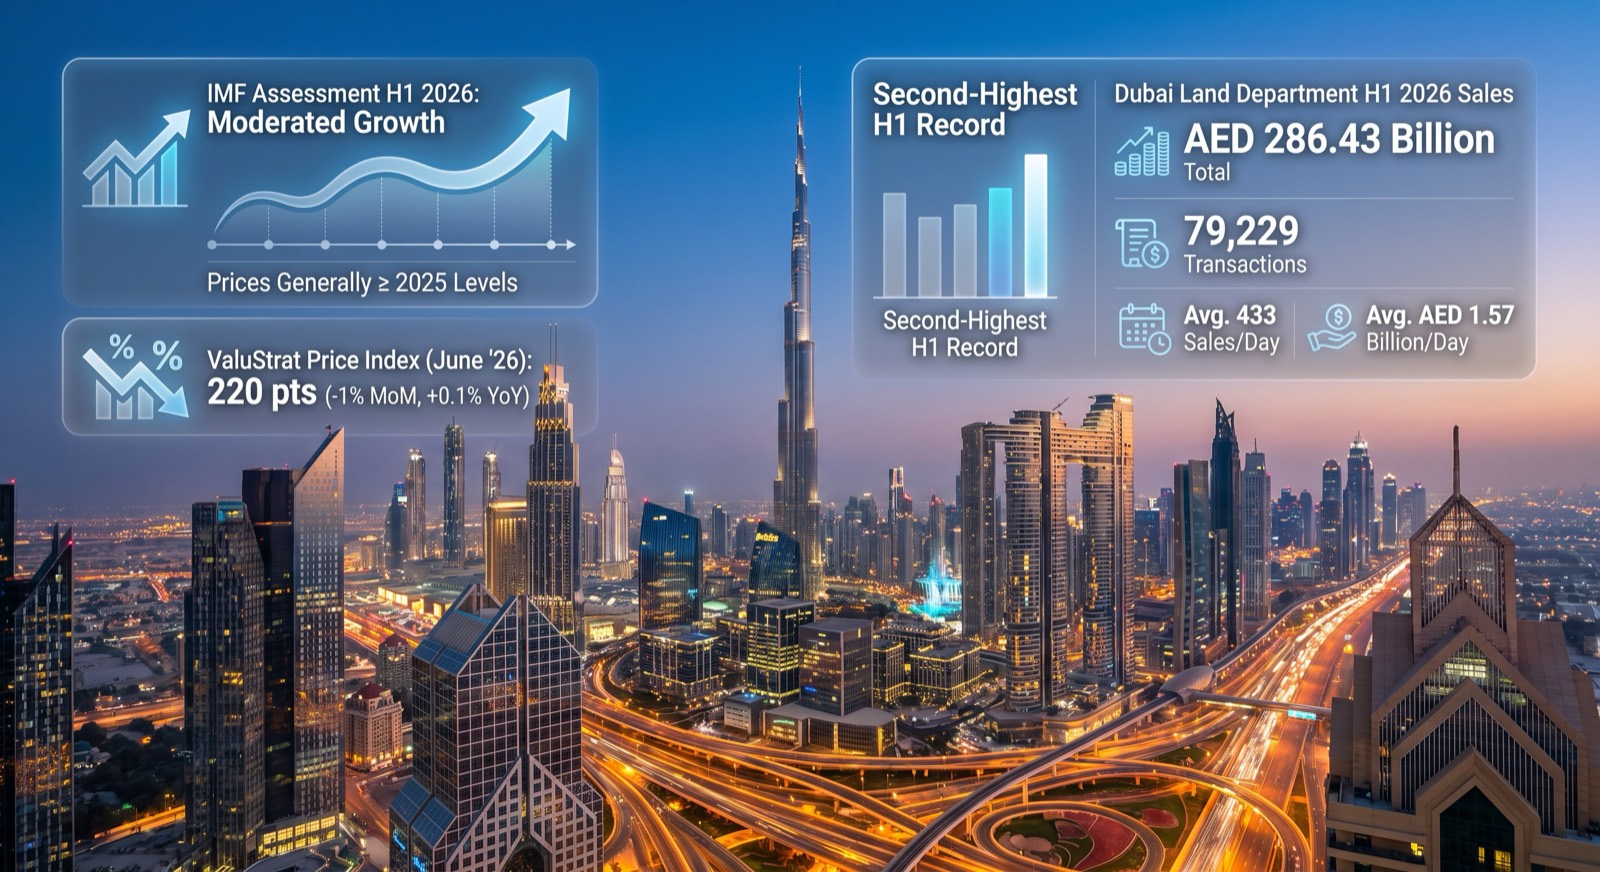
The IMF concluded its staff visit to the UAE on July 16 and issued its assessment the following day: UAE real estate activity moderated in the first half of 2026, with prices broadly remaining at or above their 2025 levels. That sentence — from the Fund's mission chief Said Bakhache — is the most authoritative third-party characterisation of this market available, and it is worth sitting with carefully. Moderation underpinned by resilience is materially different from contraction — and the week’s data supported both elements.
The headline H1 number for Dubai is large — AED 286.43 billion of property sales — but its monthly composition tells a more instructive story about where the market actually is. And running alongside the Dubai data, a second story got far less attention than it deserved. While Dubai cooled, Abu Dhabi's transactions rose 112% to AED 117 billion in the same half. Capital did not leave the UAE. It redistributed across it.
If you're weighing entry points while this market reprices, I can show you where the risk-adjusted opportunities are emerging. Click here to speak with me directly.
The most authoritative source of the week was the IMF's concluding statement on its staff visit to the UAE, led by Said Bakhache.
The IMF's assessment of the UAE property market was direct: real estate activity "moderated in the first half of 2026 following several years of strong expansion," with the impact "uneven across segments and locations," and prices "generally remaining at or above their 2025 levels." On banking, the Fund said exposure to real estate is "contained," though "evolving market conditions warrant continued monitoring."
Two phrases stand out. First, “uneven across segments and locations” — the IMF is explicitly signalling a fragmenting market rather than a broad-based decline, a dynamic clearly visible in the community-level price data. Second, “at or above their 2025 levels,” which draws a critical line between an orderly correction and a crash. Values are easing from a peak, not collapsing.
One point of precision on what this statement does not contain: no numeric 2026 GDP projection, no inflation figure, no credit data. It is a qualitative assessment. On the broader economy, the IMF expects overall GDP to be "slightly below its 2025 level" before a significant rebound in 2027. The Fund's independence — it has no position in Dubai property and no product to sell — is exactly what gives this framing its value. When the IMF says moderation with resilience underneath, that is the closest thing to a neutral reading available.
The Dubai Land Department's latest H1 figures show property sales reached AED 286.43 billion across 79,229 transactions between January and June 2026 — equating to an average of 433 sales per day and AED 1.57 billion in daily value. The cumulative total represents the second-highest H1 on record, spanning residential, commercial, and land segments.
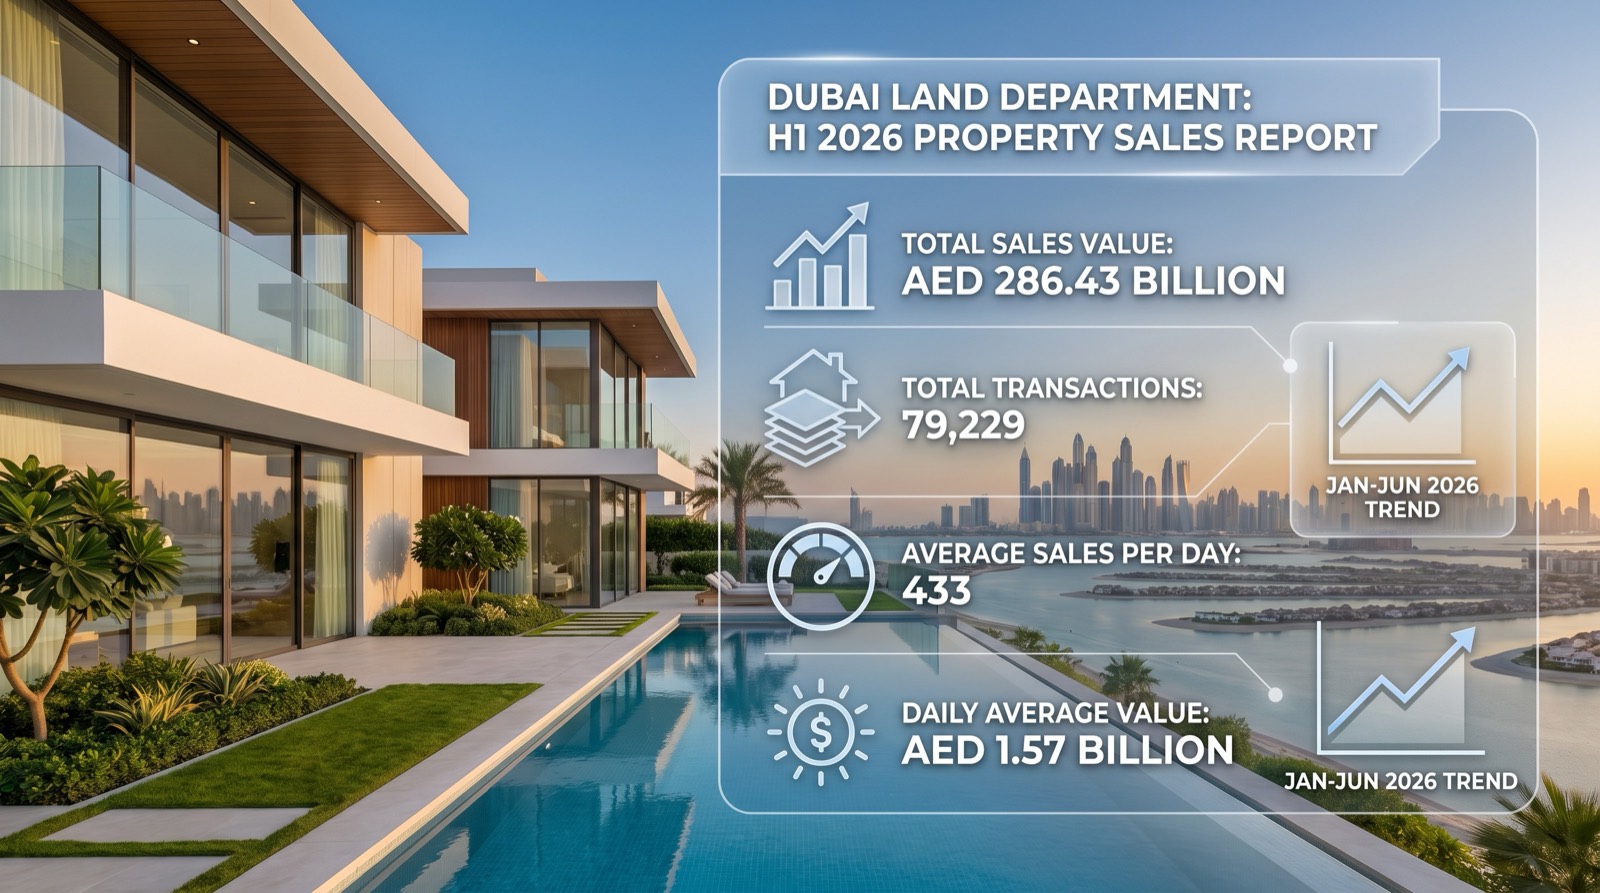
The monthly breakdown is where the deceleration becomes clear. January delivered AED 72.16 billion across 15,896 transactions, while June recorded AED 32.66 billion across 13,766 transactions. This means transaction value fell to roughly 45% of January’s level, even as volume held up relatively well at around 87%.
The widening gap between declining value and resilient transaction counts is characteristic of a market shifting toward lower-ticket segments — more deals, but fewer large-ticket transactions driving the headline totals.
One clarification on the number itself: the AED 286.43 billion covers all segments — residential, commercial and land. Residential-only figures are lower. That is not a discrepancy — it is a difference in what each figure measures.
The ValuStrat Price Index for June 2026 shows the headline VPI at 220 points — down 1% month-on-month, with annual growth at 0.1% and a cumulative 10% adjustment since February 28. The pace of decline is slowing: March recorded -5.9%, April -1.9%, May -1%, June -1%. Villas sit at 293.7 points (down 1.2% monthly, still up 2% annually). Apartments sit at 169.1 points (down 0.6% monthly, down 3% annually).
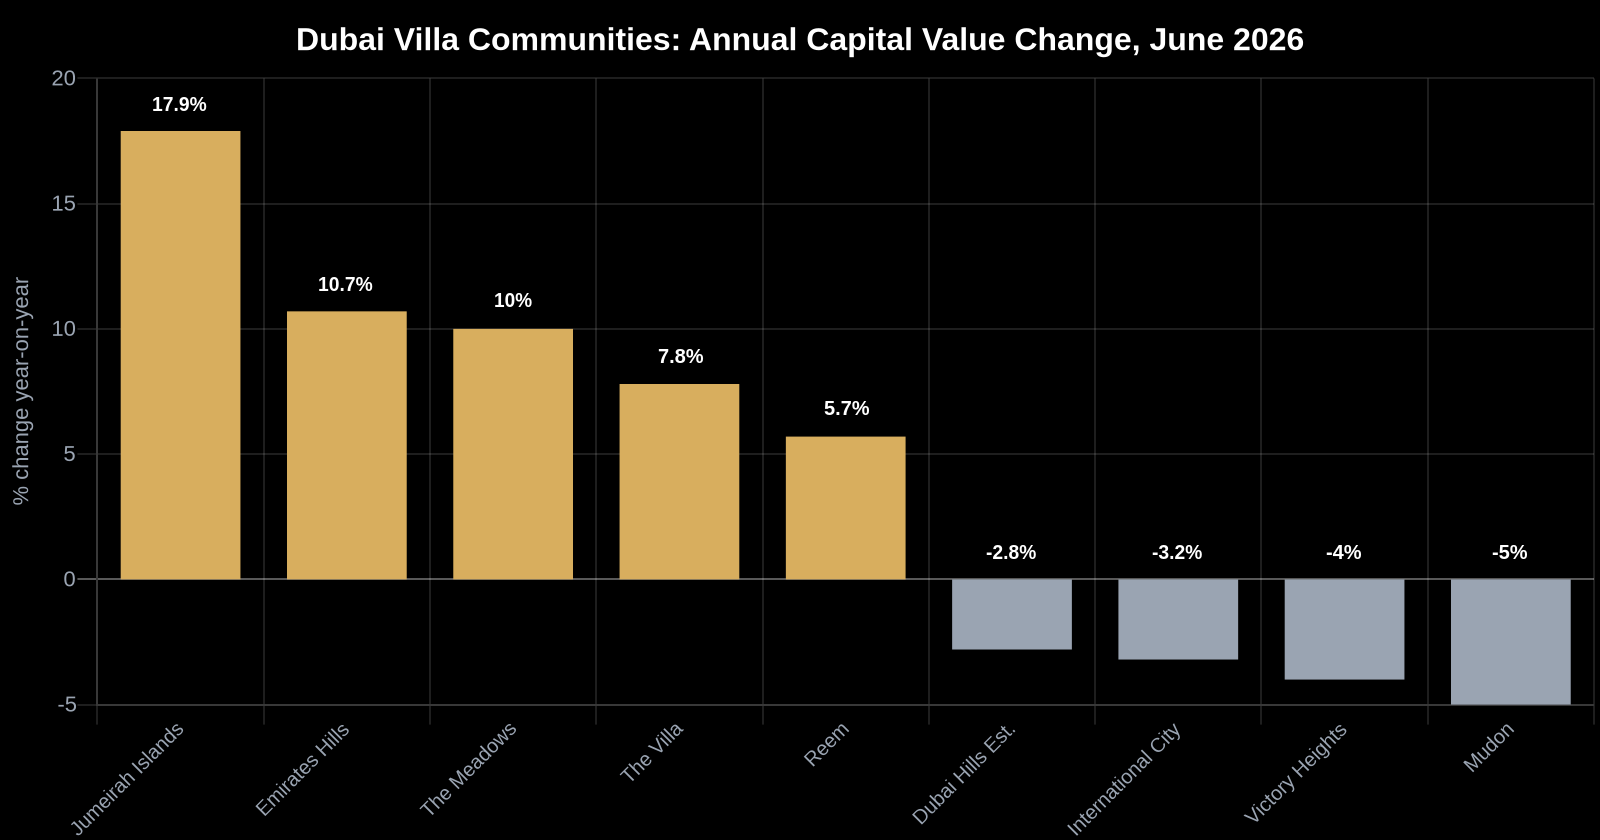
The real story lies in community-level dispersion. Among villas, the strongest annual performers were Jumeirah Islands (+17.9%), Emirates Hills (+10.7%), The Meadows (+10%), The Villa (+7.8%), and Reem (+5.7%). Annual corrections were seen in Mudon (-5%), Victory Heights (-4%), International City (-3.2%), and Dubai Hills Estate (-2.8%). No monitored villa community recorded a monthly gain in June.
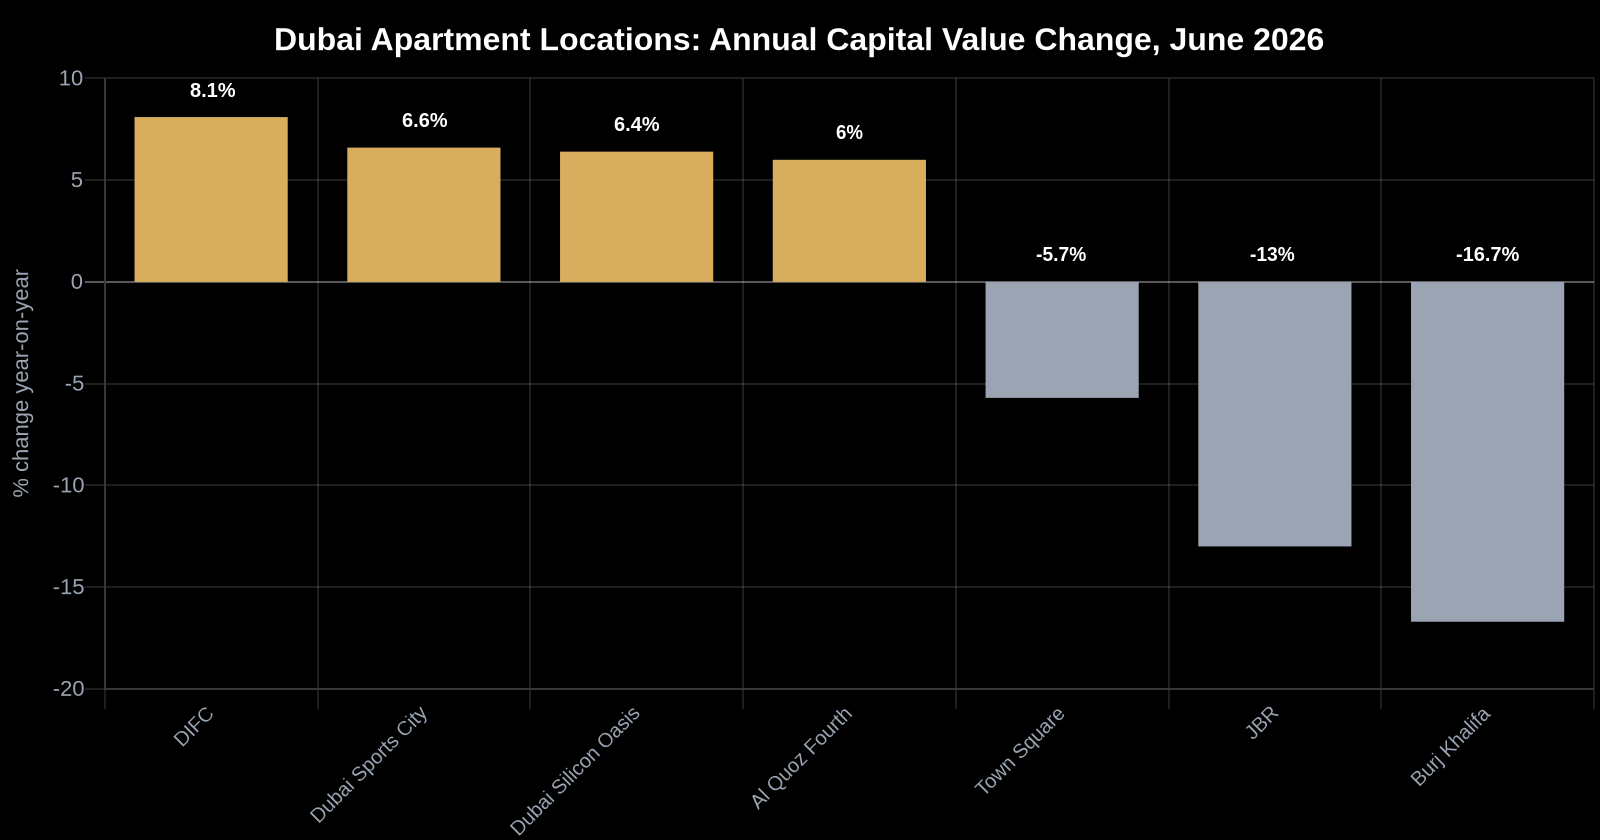
Among apartments, top annual performers included DIFC (+8.1%), Dubai Sports City (+6.6%), Dubai Silicon Oasis (+6.4%), and Al Quoz Fourth (+6%). The largest contractions were in Burj Khalifa (-16.7%), Jumeirah Beach Residence (-13%), and Town Square (-5.7%).
This produced a roughly 25-percentage-point spread between the best and worst performing apartment locations over twelve months — all within a single city.
This dispersion makes the strongest case yet against referring to “the Dubai market” as a uniform whole. Established, supply-constrained communities with limited new deliveries continue to appreciate, while locations facing heavy supply or reliant on short-let and investor demand are repricing sharply.
On transactions, ready-home sales rose 46.8% month-on-month in June — the strongest monthly increase in three years — though they remained 23% below June 2025 levels. Off-plan Oqood registrations increased 32% on the month but stayed 16% below last year, accounting for 75% of all sales. The 46.8% rebound is real, but it reflects a recovery from a low base in one segment, not a broad market turnaround.
| Dubai residential, Q2 2026 (Savills) | Data |
| New units launched | ~5,335 (vs 45,000+ in Q1) |
| Units handed over | ~27,300 (multi-year quarterly high) |
| Total transactions | 35,884 (-19% quarter-on-quarter) |
| Apartment values | AED 1,960/sqft (-4% QoQ) |
| Villa values | AED 1,646/sqft (-0.8% QoQ) |
| Ejari registrations | -22% QoQ; rents -8% to -10% |
Savills' Q2 report explains why the community divergence looks the way it does. Dubai handovers reached roughly 27,300 units in the quarter — comprising approximately 17,400 apartments and 9,900 villas and townhouses — the highest quarterly delivery in recent years. Simultaneously, new launches collapsed to approximately 5,335 units in Q2, against more than 45,000 in Q1.
The near-90% drop in launches reflects developers responding rationally to current market conditions — a move that is constructive for 2029 and beyond. But it does nothing for the next thirty months, because the units arriving now were launched in 2022 and 2023. The mechanism is direct: where the 27,300 units landed, prices are under pressure; where nothing new is being delivered, they are not.
The ValuStrat community map above is the supply map expressed in price form. Total Q2 transactions reached approximately 35,884, down 19% quarter-on-quarter. Apartment values settled at around AED 1,960 per sq. ft. (-4% QoQ) and villa values at AED 1,646 per sq. ft. (-0.8% QoQ).
Ejari registrations fell 22% quarter-on-quarter, with rents retreating 8% to 10% — the same delivery pressure now working through the rental market with a one-quarter lag.
The same Savills' Q2 report records transactions above AED 10 million falling 54% quarter-on-quarter to 864 deals, with activity concentrated in Palm Jumeirah, Dubai Hills Estate and Jumeirah Golf Estates.
This sits alongside — not against — the Knight Frank H1 data covered last week, and the distinction matters. Savills is counting deals above AED 10 million (roughly USD 2.7 million), measured quarter-on-quarter. Knight Frank's record H1 figure measures above USD 10 million — a threshold nearly four times higher in USD terms — over a full half-year.
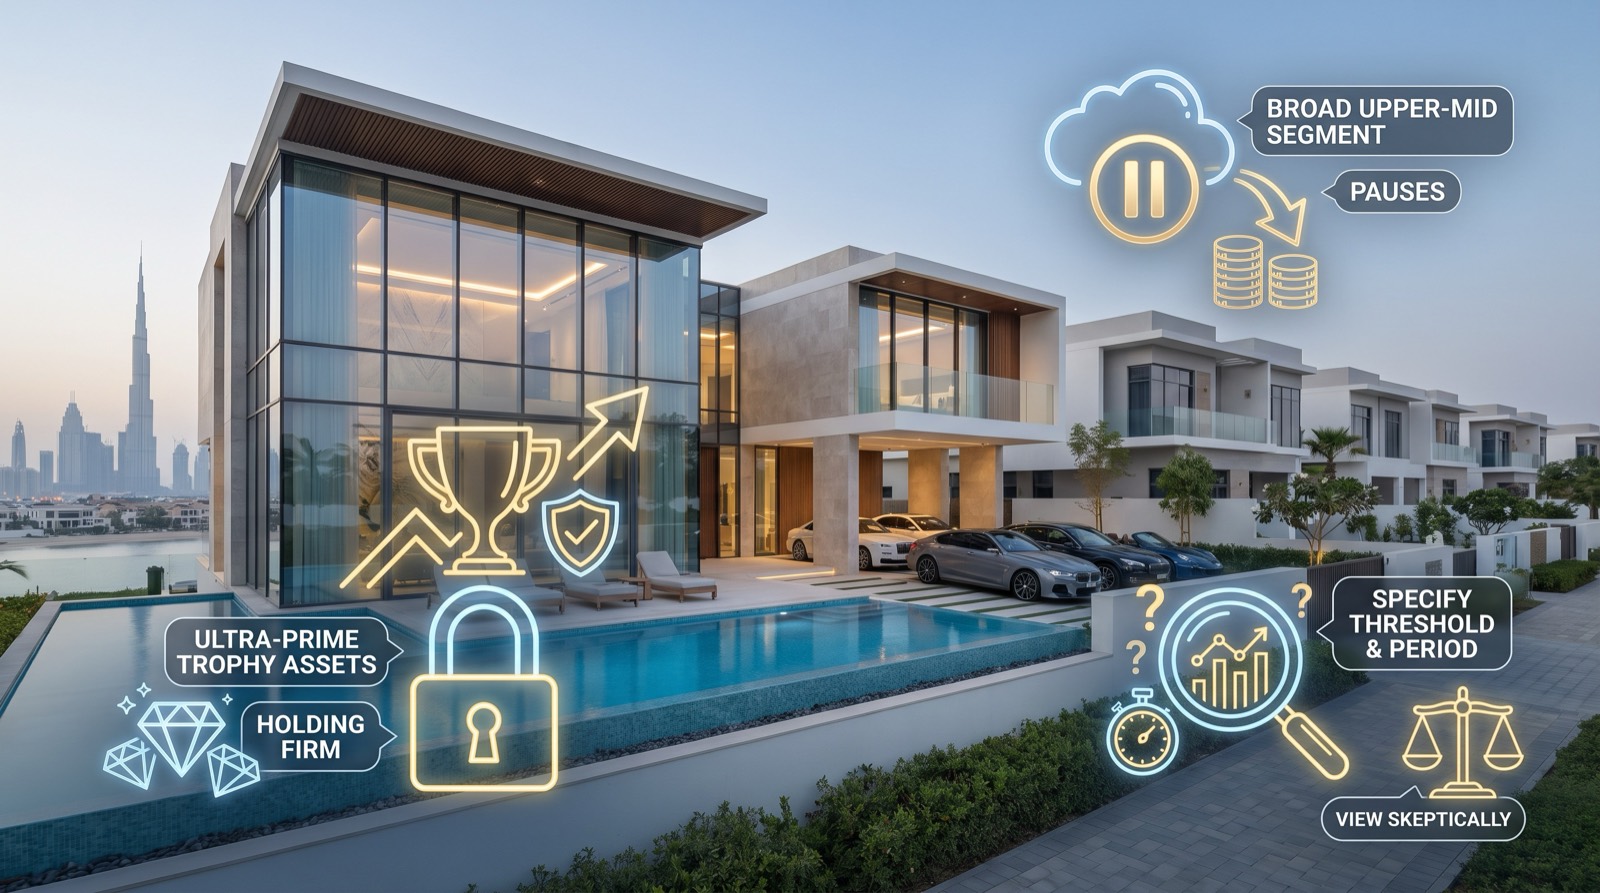
Both readings can be accurate simultaneously: trophy assets at the ultra-prime level holding firm while the broad upper-mid segment pauses. Any claim that “luxury is booming” or “luxury has collapsed” should be viewed sceptically if it fails to specify the price threshold and measurement period.
ADREC’s official H1 data, released via the Abu Dhabi Media Office, shows real estate transactions reached AED 117 billion — a 112% increase in value and 61.7% rise in volume year-on-year. Sales contributed AED 86.1 billion across 16,838 deals (+163.7%), while mortgages totalled AED 26.7 billion across 8,876 deals (+33%). Investment zones attracted AED 75 billion, up 181%.
The standout number is foreign direct investment. Property FDI into Abu Dhabi surged to AED 13.8 billion — a 309% jump year-on-year — already surpassing the full-year 2025 total. Buyers came from 116 nationalities, up from 82 the previous year, led by the UK, China, the Russian Federation, the US, Germany, and France.
Abu Dhabi and Dubai are operating at different stages of their cycles. Dubai is absorbing a substantial delivery pipeline after three years of rapid expansion. Abu Dhabi, starting from a smaller base, is actively opening new investment zones — making a 112% gain feasible there while it would be unrealistic in Dubai.
The 33% growth in mortgages is equally telling: it points to a maturing buyer base supported by financing, rather than purely speculative flows.
For UAE-wide portfolios, concentrating entirely in one emirate now carries a meaningful diversification cost that simply did not exist eighteen months ago.
Explore curated office and retail opportunities in Dubai and Abu Dhabi at Mitchell's Commercial Realty.
Still reading
Need expert help on this subject?
Dubai's GDRFA issued approximately 66,000 Golden Visas and 1.051 million new residency permits in H1 2026, alongside more than 910,552 renewals. Population growth and residency formation remain robust — and this is ultimately what fills units.
A market absorbing roughly 27,300 units per quarter requires precisely this scale of demographic inflow. It also helps explain why the rental correction has remained orderly: new supply is being absorbed by documented, ongoing tenant demand rather than entering a vacuum.
Brent crude closed at USD 88.10 on July 17, heading for a third consecutive weekly gain of roughly 14%, as renewed US-Iran hostilities threatened Strait of Hormuz flows again. The financing implication for Dubai buyers runs directly through the dirham's peg to the dollar.
Ahead of the July 29 FOMC meeting, market pricing points to a hold, with the residual risk skewed toward a hike rather than a cut. Any underwriting model that assumes materially lower financing costs before 2027 is working against what the market is currently pricing — and with oil at USD 88 putting upward pressure on US inflation, the case for an early cut has not improved this week.
In closing
Final View for Dubai Property Investors
The averages are the problem this cycle, not the answer. Emirate-level headlines, threshold-free luxury figures, and half-year aggregates all obscure the two factors that now drive outcomes: which community an asset belongs to, and where it sits on the current handover schedule.
Three clear implications follow:
Underwrite the community, not the emirate. The performance gap between the best and worst locations has exceeded 20 percentage points over the past twelve months, and it is fundamentally a supply story. Assets within a two-kilometre radius of the active delivery wave are operating in a markedly different market from those that are not — regardless of what citywide indices suggest. The sharp pause in new launches is positive for 2029 and beyond, but it provides no relief over the next thirty months.
Do not price in material rate relief before 2027. With the Fed pricing a hold and residual risk skewed toward a hike, and oil at USD 88 adding upward pressure on US inflation, the dirham peg transmits this timeline directly to Dubai buyers. Underwriting models that assume significantly lower financing costs before then are positioned against current market pricing.
Treat Abu Dhabi as a live allocation, not a footnote. Official ADREC figures show a 309% surge in property FDI and 112% growth in transactions — numbers from a market operating at a genuinely different stage of its cycle. UAE-wide capital is already redistributing accordingly; any portfolio that ignores this is taking on concentration risk that simply did not exist eighteen months ago.
The IMF’s characterisation — moderation with underlying resilience — remains the most accurate read of the aggregate picture. For investors, however, the question is more precise: on which side of that moderation does the specific asset sit, and does the supply outlook in its immediate catchment area support the underwriting assumptions for the next twelve months?
Next step
Let’s Talk
If you’d like to unpack where the most resilient opportunities are emerging — in stabilised residential areas or income-generating commercial zones — I’d be happy to share a focused, data-driven shortlist based on your investment goals.
📞 No pressure, no sales pitch—just a focused, informed conversation about your investment goals.
Published 20 July 2026 by Stephen James Mitchell MBA. Market figures quoted reflect the data available at that date.