Will the Dubai Property Market Crash in 2026: Separating Geopolitical Panic from Structural Decline
- Stephen James Mitchell MBA

- Mar 19
- 6 min read
Updated: Apr 3

Introduction
The DFM Real Estate Index fell approximately 21% — from roughly 16,700 to 13,353 points — in the two weeks following Iranian strikes on UAE soil in late February 2026. Goldman Sachs reported transaction values collapsed 51% month-on-month in the first half of March. Yet median apartment prices per square foot declined only 3% year-on-year, while villa prices rose 16%. Two forces are operating simultaneously: a geopolitical sentiment shock compressing liquidity, and a pre-existing supply cycle that Fitch Ratings flagged in May 2025 when it forecast a correction of up to 15%. Investors who conflate these two forces will misprice risk in both directions.
The Signal
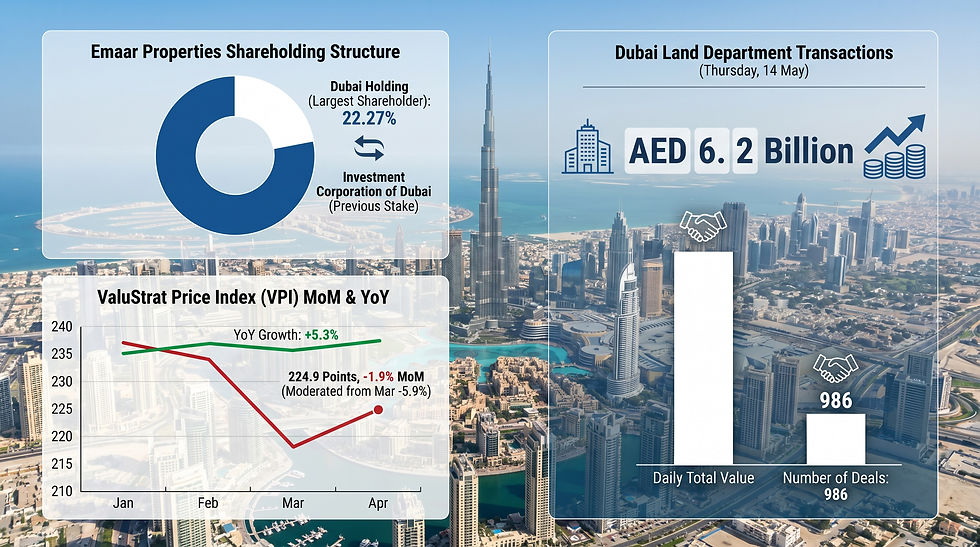
When Iranian projectiles struck UAE targets on 28 February 2026, regulators ordered the DFM exchange closed for two days; when trading resumed, the General Index fell 4.7% in a single session. Reuters reported Dubai's safe-haven reputation faced its most direct test. Emaar Properties shares fell nearly 40% from pre-conflict levels per Goldman Sachs data. At the same time, 3,570 transactions closed in the week of March 2–9, generating AED 11.93 billion in deal value, and a $422 million apartment transacted mid-conflict.
What This Means for Investors
The Index vs. Physical Values: The Core Dubai Property Market Crash 2026 Distinction
The DFMREI fell approximately 21% — tracking developer equity — while the citywide median transacted price stood at AED 1,770/sqft as of March 8, up 14% year-on-year. Goldman Sachs data shows apartment prices down 3% year-on-year and 8% month-on-month; villas rose 16% year-on-year despite a 2% monthly dip.
Transaction values in the first half of March were down 31% year-on-year and 51% month-on-month; the second week saw secondary market values fall 59% and villa transaction values fall 89% year-on-year. This is a liquidity freeze, not a valuation collapse — prior disruptions produced smaller MoM declines: Dubai floods (April 2024) at 19%, Iran-Israel escalation (November 2024) at 32%. The market intelligence dashboard provides current transaction data.
The Pre-Existing Supply Cycle: Where the Structural Risk Resides
Fitch Ratings warned in May 2025 of a correction of up to 15%, driven by projected unit deliveries. For 2026, approximately 71,613 units are formally forecast; applying the historical 48% completion rate implies a realistic delivery of approximately 34,000 units — still above the long-run annual absorption figure of 27,000–30,000. Moody's expects the 2026–2028 pipeline to average 60,000 annual deliveries, roughly double the historical norm.
Supply pressure concentrates in the off-plan segment, which represented 65% of all Dubai transactions in 2025 and 69% in early March 2026. Off-plan apartments at peak pricing — AED 2,500–2,600 per square foot — are most structurally vulnerable: Citi slashed its Dubai population growth forecast from 4% to 1% for 2026, materially impairing demand assumptions at those price levels. Engel & Völkers February 2026 data shows Downtown Dubai at AED 2,980/sqft, Business Bay at AED 2,673/sqft, Dubai Marina at AED 2,061/sqft, and JVC at AED 1,448/sqft. The current pipeline tracks distressed opportunities as forced sellers emerge.
Three-Scenario Framework and Yield Implications
The table below maps three conflict-duration scenarios against price and yield implications.
Scenario | Conflict Duration | Physical Price Impact | Net Yield Outlook (Apartments) | DFMREI Trajectory |
De-escalation by April 2026 | 4–6 weeks | Flat to –5%; rapid sentiment recovery | 6.7–7.0% (stable, near current average) | Recovery toward pre-conflict highs |
Prolonged low-intensity conflict | Q2–Q3 2026 | –10% to –15%; off-plan slowdown | 6.2–6.5% (mild expansion on price decline) | Sideways to mild recovery |
Major escalation / Hormuz risk | 6+ months | –20% to –30%; structural correction | 5.5–6.0% (capital flight offsets expansion) | Further significant downside |
Sources: Leasense scenario analysis; yield ranges derived from Engel & Völkers December 2025 data (current apartment average: 7.07%).
Engel & Völkers data placed the overall Dubai average at 6.76% in December 2025, with apartments at 7.07% and villas at 4.93%. Submarket yields per GuestReady's 2026 analysis: JVC studios 7.87%, Al Furjan apartments 8.51%, Dubai Sports City 1-bed 8.8%, Downtown Dubai studios 7.92%. The investor tools allow stress-testing entry scenarios against varying price assumptions.
Structural Buffers: What Did Not Exist in Prior Corrections
UAE bank real estate lending fell to 14% of gross loans at end-2024, down from 20% at end-2021 per Fitch. 87% of Dubai property purchases in 2025 were cash transactions, eliminating the forced-liquidation cascades of 2009. RERA oversight, Oqood registration, and bank-held escrow accounts provide regulatory architecture that did not exist during the previous crash. The AED 302.7 billion government budget for 2026–2028 allocates 48% to infrastructure, including Metro Blue Line connectivity projected to boost values near 14 new stations by up to 25%. These factors do not prevent a cyclical correction. They prevent a systemic collapse.

Risk Assessment
The primary risk variable is conflict duration. Under de-escalation, a flat-to-5% physical price dip with rapid sentiment recovery is the central case. Under prolonged low-intensity conflict, a 10–15% correction with off-plan slowdown is probable, compounding the supply headwind; Citi's analysis flags a potential 20% drop extending annual declines through 2028. A Hormuz escalation would produce a 20–30% structural correction.
Overall risk: Medium-High. Leveraged off-plan positions at AED 2,500+/sqft face the most acute exposure; ultra-luxury above $8 million, dependent on a safe-haven narrative now materially impaired, is the second most vulnerable tier. A 2009-scale collapse requires simultaneous failure of regulatory safeguards, banking buffers, and government fiscal capacity — no current data supports that scenario. Our investor guides cover the structural differences in detail.
Action Framework
Decouple the DFMREI from physical asset valuation. Emaar down 40% does not mean a Downtown Dubai property is worth 40% less. Track per-sqft transaction data, not equity indices.
Stress-test off-plan positions at 1% population growth, not 4%. Model breakeven under a 10–15% price decline from Q1 2025 peak pricing at AED 2,500–2,600+/sqft.
Monitor secondary villa liquidity weekly. The 89% year-on-year transaction collapse in March's second week signals price discovery has not occurred — forced sellers are the leading indicator.
Audit submarket exposure by sqft price tier. Units at AED 1,400–1,700/sqft in JVC, JLT, and Dubai Sports City carry lower capital risk at gross yields of 7.07–8.8%.
Preserve liquidity for secondary market entry. Every prior Dubai correction produced the cycle's best entry points for cash buyers.
Confirm escrow compliance on all off-plan holdings. RERA's Oqood system allows online verification; escrow drawn outside verified milestones requires immediate legal review.
Key Data Points
Metric | Value | Source |
DFMREI decline (Feb 28 – March 9, 2026) | –21% (16,700 → 13,353 pts) | AInvest / Leasense |
Transaction value decline (first half March, MoM) | –51% | Goldman Sachs via Investing.com |
Median apartment price/sqft change (March 1–12, YoY) | –3% (–8% MoM) | Goldman Sachs via Investing.com |
Citywide median price/sqft (March 8, 2026) | AED 1,770 (+14% YoY) | Sherwoods Property |
Cash buyer share (2025 transactions) | 87% of all purchases | Sherwoods Property |
Average gross rental yield — apartments (Dec 2025) | 7.07% | Engel & Völkers |
UAE bank RE lending / gross loans (end-2024) | 14% (down from 20% in 2021) | Fitch via The National |
Forecast 2026 deliveries (realistic, 48% completion rate) | ~34,000 of 71,613 planned | Morgans Realty |
Dubai government infrastructure budget 2026–2028 | AED 302.7 billion | Reuters |
Summary
Is the Dubai property market actually crashing in 2026?
The DFMREI (developer stocks) fell 21–30%, but median transacted prices fell only 3% year-on-year through mid-March, with the citywide median at AED 1,770/sqft still up 14% year-on-year. Transaction liquidity has frozen; valuations are largely intact.
Which property segments face the most acute risk?
Off-plan apartments at AED 2,500–2,600+/sqft carry the greatest exposure: Citi's revised population growth forecast of 1% (vs. 4% previously) undermines demand assumptions at handover. Secondary market villas saw an 89% year-on-year transaction decline in March's second week; ultra-luxury above $8 million is similarly impaired. Mid-market completed apartments at AED 1,400–1,700/sqft in JVC, JLT, and Dubai Sports City carry lower capital risk at current yields of 7–8.8%.
How does this compare to the 2008–2009 crash?
Prices fell 50–60% in 2008–2009 in an unregulated, leveraged market with no escrow protections and a population of ~1.5 million. The 2026 market has RERA oversight, bank RE lending at 14% of gross loans (down from 20%), 87% cash transactions, a population exceeding 3.5 million, and 77% non-oil GDP. A 2009-scale collapse is improbable absent prolonged military escalation.
Will rental yields compress during this correction?
Apartment yields entered the correction at 7.07% — among the highest in any major global city. Existing leases provide near-term income protection. Compression risk materializes if population growth reaches Citi's 1% forecast against the 34,000-unit pipeline. Employment-hub communities with Metro access — JVC, Business Bay, Al Furjan — are likely more resilient than airport-adjacent districts.
Related Topics
Is This 2009 Again? A Data-Driven Comparison: Regulation, leverage, and population differences between 2026 and the prior crash.
The Contrarian Buyer's Playbook: Entry-point frameworks across prior Dubai correction cycles.
Off-Plan Risk Matrix: Which Developers and Projects Are Most Exposed: Off-plan positions at 2024–2025 peak pricing.
Mortgage Stress Testing: Financial modelling for leveraged positions under correction scenarios.
I update the commercial property deals and special investor deals sections as the secondary market evolves. For portfolio-specific exposure analysis, start a conversation with our team.