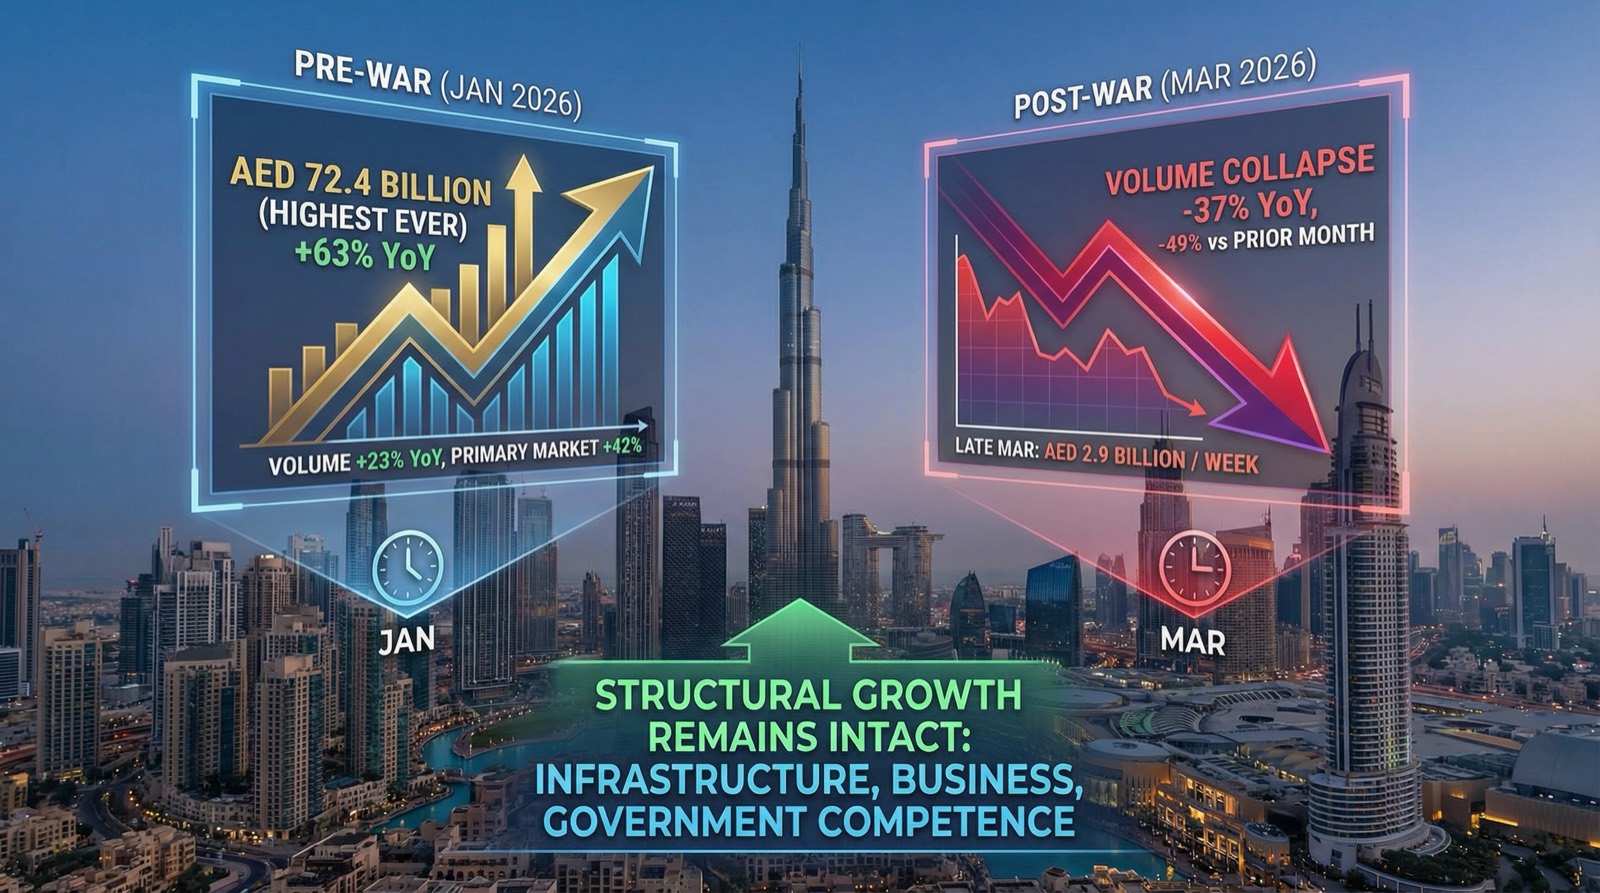
Two sets of numbers landed this week. One measures the UAE economy before the war; the other measures it under wartime conditions.
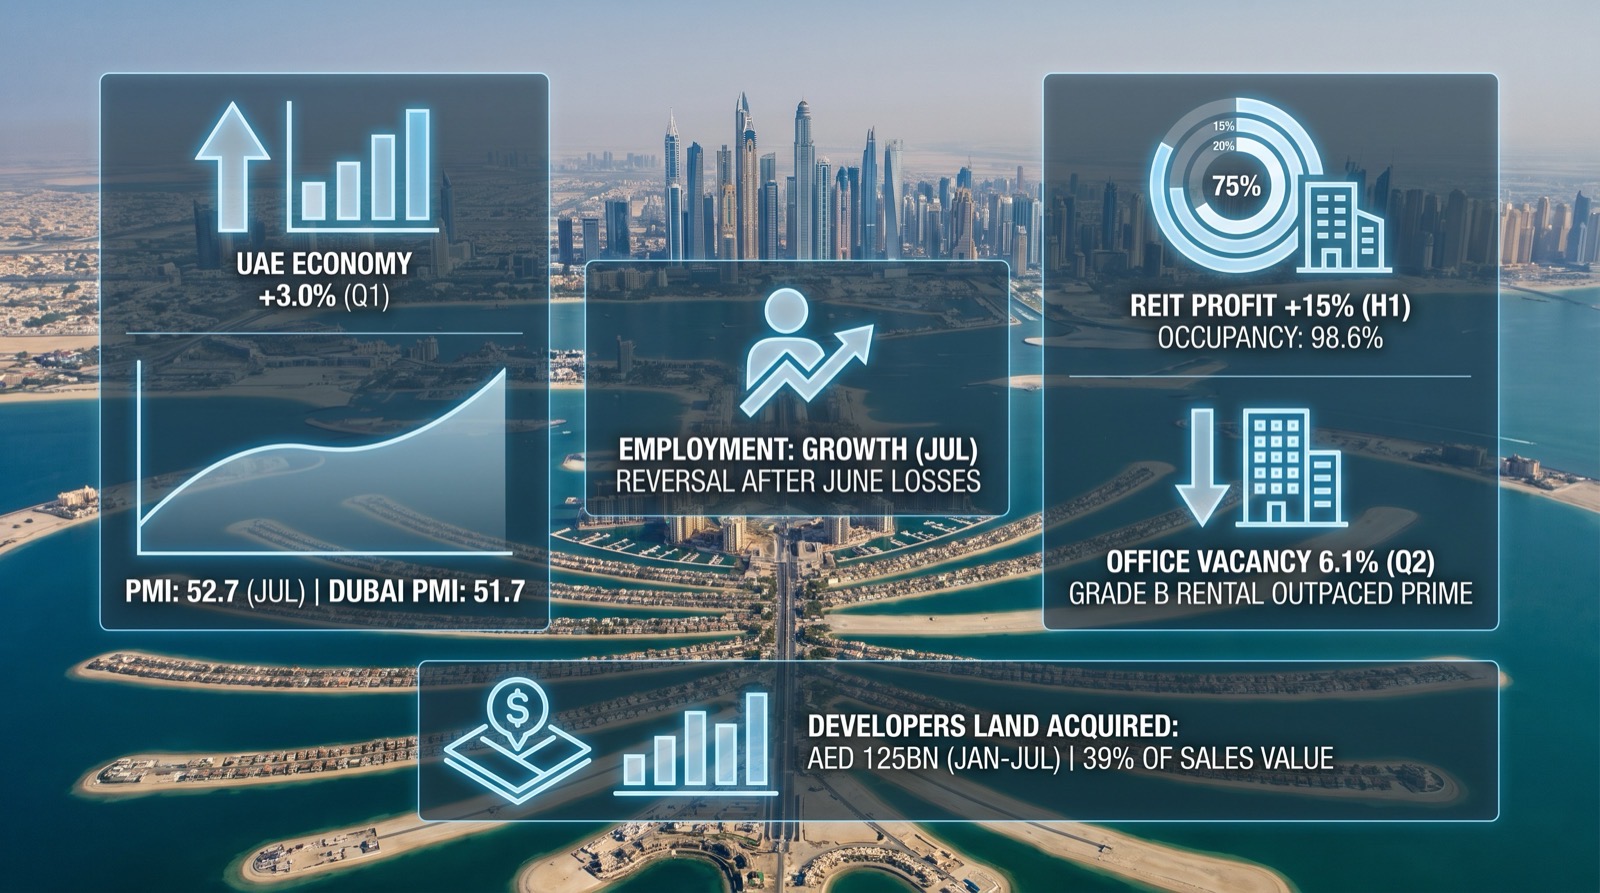
The Federal Competitiveness and Statistics Centre put first-quarter growth for the UAE economy at 3.0%, or AED 485 billion, with real estate activity up 4.8%. That quarter ran from January to March. The war began on 28 February, so roughly two-thirds of it was peacetime.
The property data released alongside it covers April to June — the first calendar quarter conducted entirely under wartime conditions. Every earlier data set mixed the two periods together. It is the first clean read on what sustained conflict costs the property market.
The gap shows up most clearly in Abu Dhabi. ValuStrat has capital values rising 17.8% year-on-year in the first quarter and 17.8% again in the second — an identical annual figure.
Over the same two quarters, ValuStrat's three-month rate fell from 6.4% to 2.1%. An investor reading only the annual number would conclude nothing had changed. The quarterly number shows growth running at a third of its previous pace.
If you're weighing entry points while this market reprices, I can show you where the risk-adjusted opportunities are emerging. Click here to speak with me directly.
The Federal Competitiveness and Statistics Centre reported real GDP of AED 485 billion for the first quarter, up 3.0% year-on-year. Non-oil GDP grew 4.8% and now accounts for 79.4% of the economy, up from 78.0% a year earlier.
Real estate activity expanded 4.8% and contributed 0.36 percentage points to overall growth. Those measure different things: the first is the sector's own growth rate, the second is its share of the economy's total expansion. Financial and insurance activities grew fastest at 17.3%, contributing 2.44 points, with construction adding 1.04 points.
The timing matters more than the figure. This quarter captured January and February in full, before hostilities began, plus one month of conflict. It is the last substantially peacetime reading the UAE will publish, and it describes the base the market entered the war from — not where it stands now. The FCSC is separately revising its national accounts, which will restate the historical series and shift the comparison points again.
A more current reading shows that S&P Global UAE PMI rose to 52.7 in July from 50.8 in June, a four-month high, with Dubai's index at 51.7.
Employment returned to growth in July after June recorded the steepest job losses in nearly six years. Hiring is what fills apartments, so that reversal matters more to a landlord than the headline index does.
The detail underneath is less encouraging. S&P Global recorded business confidence falling for a third consecutive month, with only 7% of firms expecting growth over the coming year.
Dubai's business activity rose at its weakest rate since June 2021. Companies are completing work already on their books while holding back from new commitments — a pattern that reaches office demand roughly two quarters later.
Section 02
Dubai Residential REIT Reported 15% H1 Profit Growth — Occupancy Held at 98.6%, Retention Fell in Q2
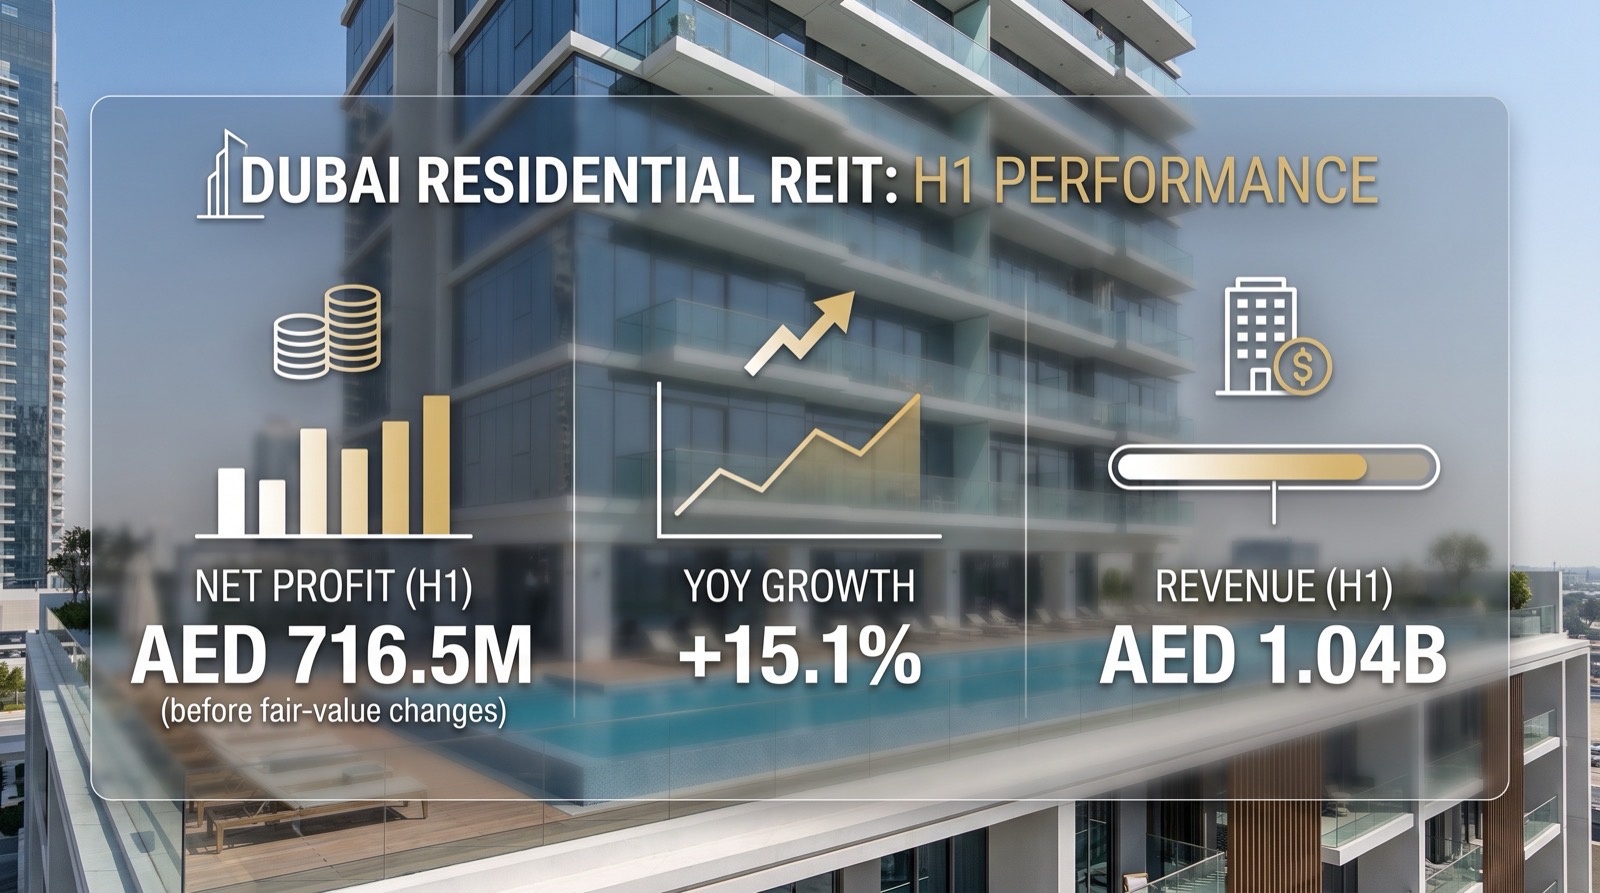
Dubai Residential REIT reported first-half net profit of AED 716.5 million before fair-value changes, up 15.1% year-on-year, on revenue of AED 1.04 billion. Adjusted EBITDA margin widened to 79.4% from 74.9%. The board approved an interim dividend of AED 573.2 million, an annualised 7.1% on the 30 June closing price.
Occupancy across 35,976 units averaged 98.6%, up from 98.1% a year earlier. The GCC's largest listed REIT is not short of tenants.
Retention, however, tells a different story. It averaged 94.1% for the half, marginally higher than the 93.8% recorded a year earlier. That headline looks like progress — until you note that first-quarter retention stood at 98.0%. Reaching a half-year average of 94.1% means second-quarter retention fell sharply. Tenants departed at a faster rate once the conflict had lasted a full quarter.
The gap between occupancy and retention is where the real cost sits. Occupancy shows units are being filled. Retention shows what it costs to keep them filled. Every departure brings a void period and a re-letting fee. In a market where asking rents are already easing, the replacement lease usually arrives at a lower rent. A REIT with nearly 36,000 units across multiple price points can absorb this in aggregate. A private landlord with three units in one tower cannot.
One more figure matters for anyone marking a Dubai portfolio to market. Gross asset value rose 6.9% to AED 25.2 billion over the half, but only 1.4% on a like-for-like basis. The rest came from acquisitions — 56 Garden View Villas and 220 units at Jebel Ali Village. Remove those purchases and the existing portfolio appreciated at roughly one-fifth of the headline rate.
| Dubai commercial, Q2 2026 (JLL) | Data |
| Office rents, Grade B (YoY) | +31.5% |
| Office rents, Grade A (YoY) | +26.2% |
| Citywide office vacancy | 6.1%, from 7.7% |
| Grade B vacancy | 8.0%, from 10.9% |
| Grade C vacancy | 10.9%, from 12.7% |
| Office lease registrations | +24.6% YoY / +15.1% QoQ |
| Total office stock | 100.6 million sq. ft. |
JLL's second-quarter UAE review put Dubai citywide office vacancy at 6.1%, down from 7.7% a year earlier, across total stock of 100.6 million sq. ft. Rental contract registrations rose 24.6% year-on-year and 15.1% quarter-on-quarter, driven primarily by new contracts rather than renewals. Roughly 940,000 sq. ft. of new supply is due before year-end.
Office remains the only segment where the data points consistently in one direction. The second-quarter figures show a wartime period outperforming both the previous peacetime quarter and the one before it — something no other market segment managed in the same period.
The unusual finding in JLL's data is that cheaper stock is repricing the hardest. Grade B rents rose 31.5% year-on-year against Grade A's 26.2%. Normally the best buildings lead a recovery. Here the reverse is happening: occupiers priced out of prime space are moving into secondary buildings instead of leaving the market. That shift cut Grade B vacancy from 10.9% to 8.0% over the year.
These numbers sit well above the figures reported a week ago. CBRE put Dubai average office rent growth at 13% and prime growth at 16% for the same quarter. The two houses are measuring different things. CBRE tracks a citywide average across all grades; JLL tracks growth by grade, and the weakest stock is rising quickest. Both sets of numbers can be true at the same time. The gap itself is the useful finding: a single average hides the grade-level divergence that office investors need to see.
Abu Dhabi is tighter still. Prime office availability sat at 0.1% in the second quarter, with overall vacancy at 1.4%. Prime rents rose 11.7% year-on-year, Grade A 5.1% and Grade B 4.2%. The increases look modest next to Dubai's, despite far tighter supply. The reason is regulatory, not economic. A rent freeze took effect in June, and JLL expects it to limit further rises over the medium term.
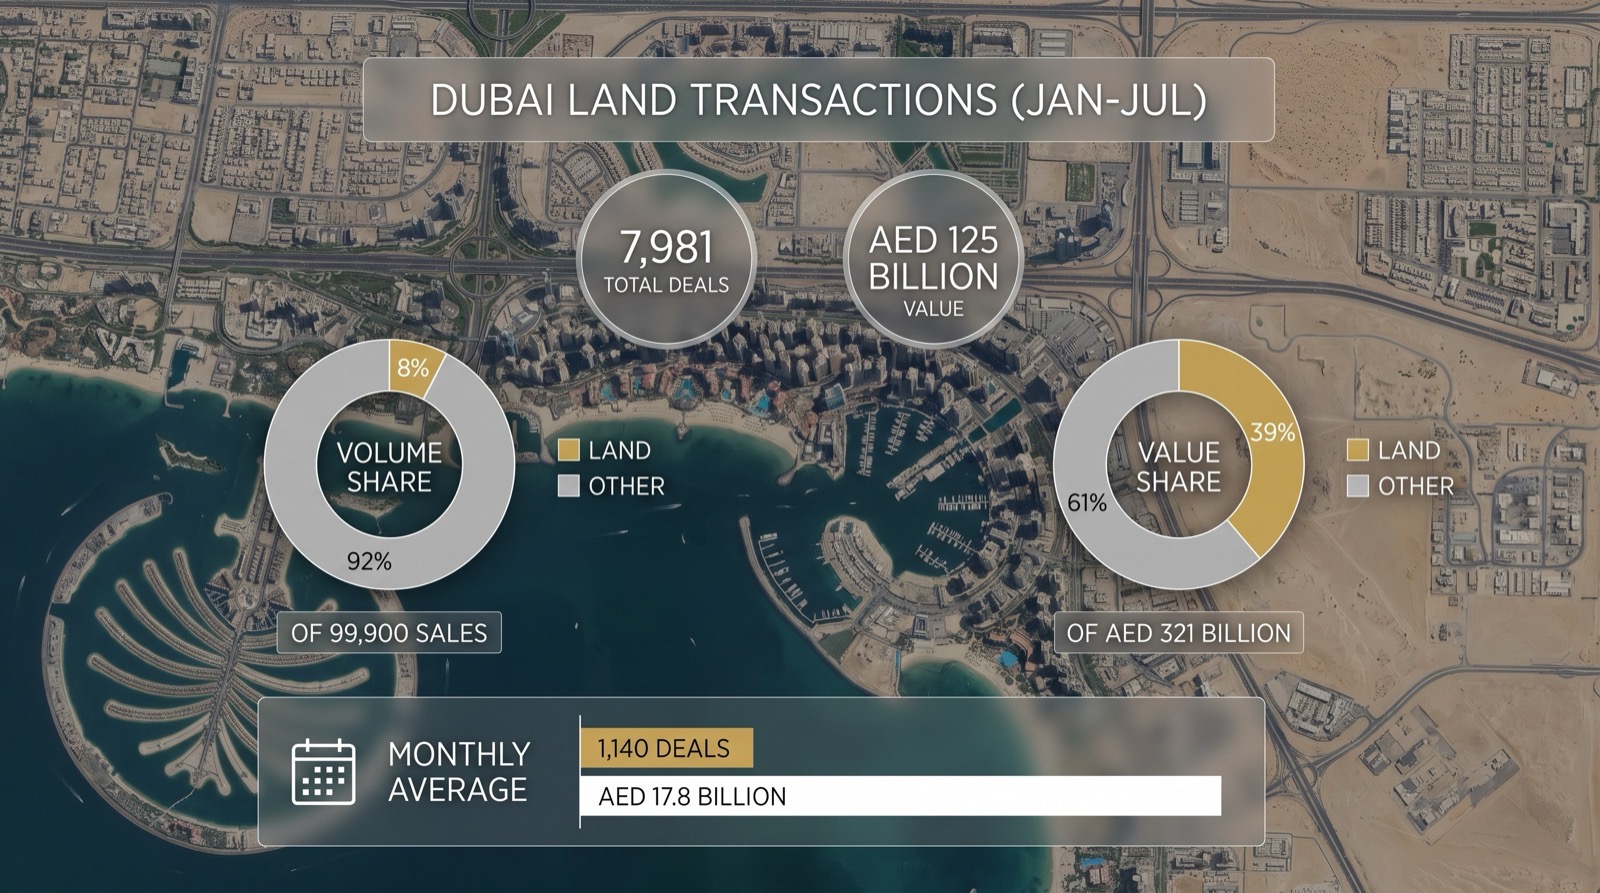
Dubai Land Department data shows 7,981 land transactions worth AED 125 billion so far in 2026. Land made up about 8% of the emirate's 99,900 sales transactions but 39% of the AED 321 billion in total sales value. That works out at roughly 1,140 deals and AED 17.8 billion a month.
Five of those seven months fell during wartime. Developers kept buying through the disruption at an average of AED 17.8 billion a month, which is the most direct statement of institutional conviction in this week's data.
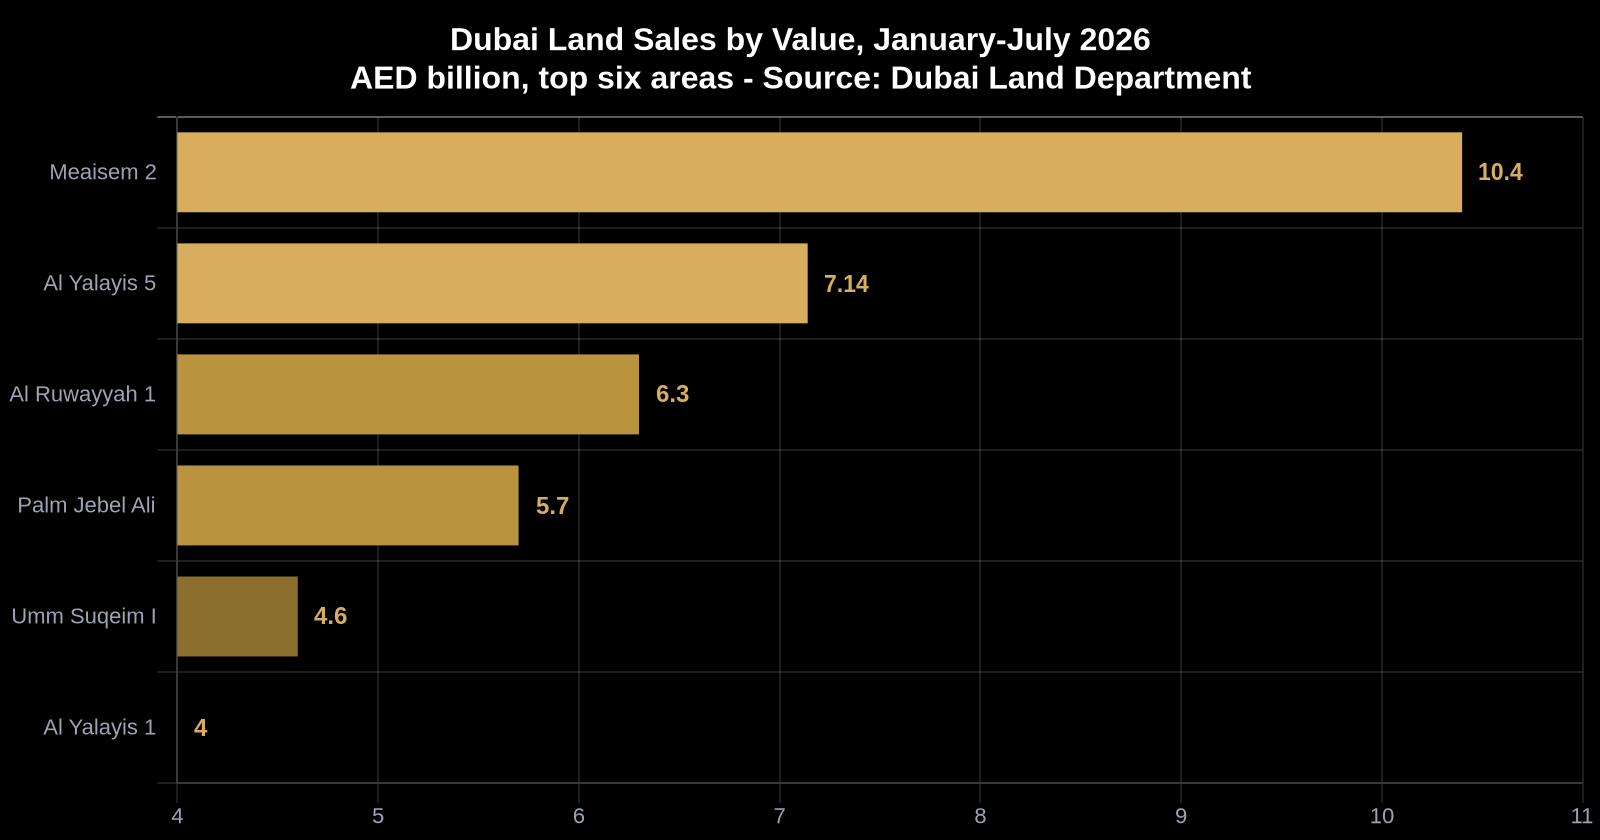
Value was heavily concentrated by location. Me'aisem 2 led at AED 10.4 billion across 544 deals, followed by Al Yalayis 5 at AED 7.14 billion across 907 deals. Al Ruwayyah 1 recorded AED 6.3 billion across just three transactions. Palm Jebel Ali contributed AED 5.7 billion across 140 deals.
Land acquired in 2026 will become project launches in 2027 and handovers from 2029 onward. That dual implication matters for investors. On the one hand, it shows large-scale capital still backs Dubai's longer-term growth path, which underpins current values. On the other, it means the late-decade supply pipeline is being replenished at significant scale.
Anyone underwriting an asset on the assumption that its surrounding district will remain low-density a decade from now should first check whether neighbouring land has already changed hands this year.
Emaar reported first-half net profit before tax of AED 12.8 billion, up 23% year-on-year. Emaar's revenue rose 21% year-on-year to AED 23.9 billion. Group revenue backlog reached AED 164.9 billion. Taken in isolation, these look like strong results.
The number that did not dominate the headlines is more revealing. Emaar Development's UAE property sales fell 45% to AED 22.4 billion from AED 40.6 billion a year earlier. That comparison sets a half containing four months of war against a peacetime half in a record year. Some of the decline reflects the conflict; some reflects coming off a peak. Either way, the direction is clear.
Unit revenue still climbed 34% year-on-year to AED 13.3 billion. Developers recognise revenue as construction progresses on units sold in earlier years, so today's revenue largely reflects sales made in 2023 and 2024. Today's sales figure shows current demand.
The second quarter in isolation is a more precise measure of war-period demand, because it sits entirely inside the conflict without the first quarter's peacetime months diluting the comparison. Attributable profit reached AED 3.7 billion, 12% below analyst consensus and 27% down on the first quarter. The share price is down 18% year to date.
Emaar is the clearest example of a pattern that runs through every set of figures released this week.
| Q2 2026: Annual vs Quarterly | Annual (YoY) | Quarterly (QoQ) |
| Emaar attributable profit | +9% | −27% |
| Dubai office rental registrations (JLL) | +24.6% | +15.1% |
| Abu Dhabi capital values — Q2 2026 (ValuStrat) | +17.8% | +2.1% |
| Abu Dhabi capital values — Q1 2026 (ValuStrat) | +6.4% | |
| Ras Al Khaimah capital values (ValuStrat) | +5.4% | −0.5% |
The pattern is identical in every row, and the same mechanism explains it. A year-on-year figure for Q2 2026 measures growth against Q2 2025. It is assembled from four consecutive quarters: Q3 2025, Q4 2025, Q1 2026 and Q2 2026. Hostilities began on 28 February, so Q2 2026 is the only one of those four periods conducted entirely under wartime conditions.
The other three were substantially peacetime, which means wartime conditions account for just one quarter of the twelve months being measured. A quarter-on-quarter figure sets April to June against January to March. Neither period contains peacetime months, so it measures the conflict's effect on demand without dilution from earlier, stronger quarters.
The forward implication matters more than any current reading. As peacetime quarters roll out of the twelve-month window, annual growth rates will fall mechanically — whether or not conditions deteriorate further. By Q4 2026, three of the four quarters inside any annual figure will be wartime periods. A valuation built on annual growth holding near current levels is resting on a comparison period that is about to change.
Emaar has a backlog of AED 164.9 billion — deep enough to absorb a decline of this size for several years. A mid-tier developer facing the same 45% sales drop, with a fraction of that order book coverage and identical delivery obligations, does not.
If you are buying off-plan, the developer's backlog and balance sheet now matter more than the payment plan. The sector is shifting from selling to delivering, and delivery consumes cash that new sales are no longer replacing at the same rate.
Still reading
Need expert help on this subject?
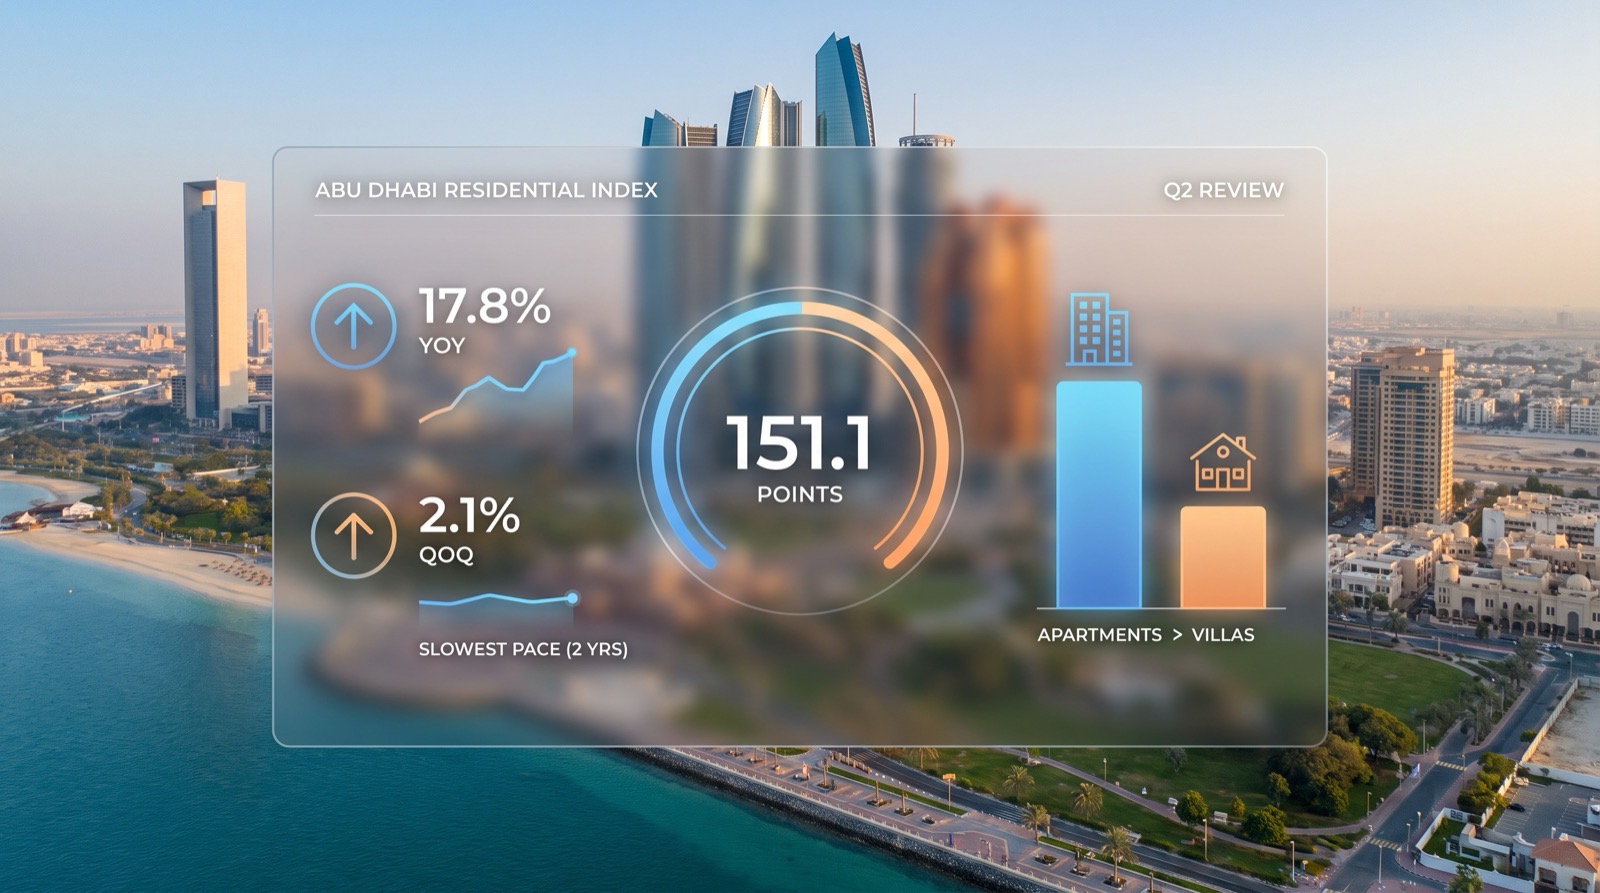
ValuStrat's Abu Dhabi review puts the residential price index at 151.1 points, up 17.8% year-on-year but 2.1% on the quarter — the slowest three-month pace in two years. Apartments continued to outperform villas.
CBRE put Abu Dhabi annual value growth at 21.6% for the same quarter, a figure reported in last week's Weekly Insights. ValuStrat's 17.8% is lower because the two houses measure differently — CBRE draws on transacted prices, ValuStrat on surveyor valuations across more than 90% of the market.
Neither is wrong. An investor should simply know which of the two a given valuation report is built on before relying on it.
Compare that with ValuStrat's previous quarterly review, which had Abu Dhabi values up 6.4% on the quarter and 17.8% annually at 148 points. The annual figure has not moved between the two quarters. The quarterly figure has fallen by two-thirds. That is the clearest illustration in this week's data of how much an annual comparison can conceal.
The index measures appraised value rather than transacted price. ValuStrat's VPI tracks what surveyors value properties at, not what buyers actually paid. Appraised values move more slowly and more smoothly than transaction prices, so a slowdown appearing in this index is a meaningful indicator rather than statistical noise.
The transaction data tells a sharper story. EnterpriseAM, citing an EFG Hermes research note, reported that Abu Dhabi's total transaction value fell 25.1% on the quarter to AED 46.6 billion, down from a record first quarter. Measured against a year earlier, it was still 81.7% higher — the same two-direction split in a second data set.
EFG Hermes attributed a 27% quarterly drop in primary-market sales to developers launching fewer projects as regional tensions resumed. Off-plan sales rose 227% year-on-year in value to AED 27.1 billion but eased 23% on the quarter. Savills separately recorded residential transaction volumes falling 9% quarter-on-quarter to 7,129 transactions, consistent with the value decline.
Two details inside those numbers matter for investors. Off-plan accounted for 84% of Abu Dhabi residential transactions in the second quarter. Many of those registrations relate to purchases agreed before the conflict escalated. Second-quarter off-plan strength therefore records decisions taken in a different environment.
Mortgage-backed transactions have fallen to 16% of total sales value, from 31% a year ago. Abu Dhabi is becoming both a cash market and an off-plan market at the same time — a shift that changes both the buyer profile and exit liquidity for anyone entering now.
Ras Al Khaimah is further along the same path. ValuStrat's RAK index eased to 123.5 points, a marginal decline over the quarter while remaining 5.4% higher year-on-year — its slowest annual pace in two years. Villa growth slowed from 7.4% annually in the first quarter to 4.6% in the second.
Abu Dhabi's June rent freeze deserves attention from investors holding rental stock there. JLL expects the freeze to hold rental increases down over the short and medium term. If your yield assumption depends on raising Abu Dhabi rents, you are now working against a regulatory ceiling. That ceiling lifts when the government decides to change it, not when demand improves.
Section 07
US Payrolls Fell 23,000 in July — September Hike Odds Dropped to 44%, Easing Rate Pressure on Dubai
The macro picture moved in the investor's favour this week for the first time in months. The Bureau of Labor Statistics reported that nonfarm payrolls fell by 23,000 in July against forecasts of an 83,000 gain. The bureau revised May and June down by a combined 103,000, bringing the twelve-month average to 34,000 jobs a month.
The composition is more mixed than the headline suggests. Within that July total, private payrolls rose 30,000 while government employment fell 53,000, led by a 50,000 drop in local government education.
Unemployment eased to 4.1%, but participation fell to 61.4%, the lowest in more than five years. The rate fell partly because people stopped looking for work, not because more found it. Average hourly earnings grew 3.2% year-on-year, the slowest since May 2021.
Last week's Weekly Insights covered the rate story after three Federal Reserve officials dissented in favour of a hike and September pricing moved above 57%. Following the jobs report, CME FedWatch pricing for a September hike fell to 44%, with October pricing at 58.3%. The debate at the Fed is still about whether to tighten, not whether to ease.
For Dubai, the link is immediate. Because of the dirham peg, the UAE Central Bank mirrors US policy and has no independent rate tool; EIBOR therefore determines local mortgage costs. A reduced chance of a hike is not a cut. The base case is still no rate relief this year, only with less downside risk than seven days ago. The next checkpoint is US CPI on 12 August.
Oil prices eased alongside the rate risk. Brent settled at USD 83.55 on 7 August, up more than 1% on the day but down more than 7% over the week. Negotiations between Iran and Oman over the Strait of Hormuz alternated between progress and stall. Traffic through the strait dropped 33% on Friday versus the previous day, according to Kpler tracking data. Lower crude prices ease the imported-inflation pressure that has kept the Fed hawkish — the channel that ultimately feeds into a Dubai borrower's mortgage rate.
In closing
Final View for Dubai Property Investors
Every valuation, sales deck and broker pitch circulating this quarter rests on annual figures that still contain three peacetime quarters. Those figures will keep reading well through the fourth quarter on base effects alone. They will fall sharply after that, as the peacetime months roll out of the twelve-month window.
That gap creates a window, and it is closing. For roughly the next two quarters, a seller can quote 17.8% annual growth in good faith while the same asset's quarterly trajectory has already turned. A buyer pricing off the quarterly series is negotiating against a number the wider market has not yet caught up to. By the first quarter of 2027, the annual figures will have repriced and that advantage disappears.
The test takes one question. Before any annual figure enters a valuation, ask what the same series shows quarter-on-quarter. If that number is not available, the annual figure is unverified.
Where the two series agree, the growth is real. Dubai office registrations rose 24.6% year-on-year and 15.1% quarter-on-quarter. That was the only segment this week where both measures pointed the same way, and the only one where supply constraint rather than the comparison period explains the number.
Where they diverge, the annual figure describes a market that no longer exists.
Next step
Let’s Talk
If you’d like to unpack where the most resilient opportunities are emerging — in stabilised residential areas or income-generating commercial zones — I’d be happy to share a focused, data-driven shortlist based on your investment goals.
📞 No pressure, no sales pitch—just a focused, informed conversation about your investment goals.
Published 10 August 2026 by Stephen James Mitchell MBA. Market figures quoted reflect the data available at that date.