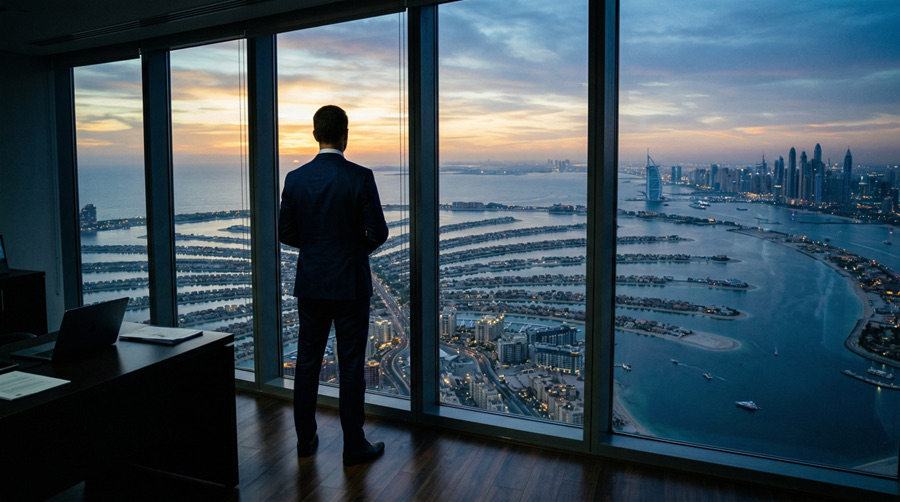
UBS published the twelfth edition of its Global Real Estate Bubble Index on 22 September 2026, scoring 23 major housing markets on how far prices have run ahead of local incomes, rents and lending. Dubai property bubble risk sits at 1.16 this year — fourth-highest of the 23 cities, up from 1.09 in the 2025 edition, and inside the band UBS labels "elevated risk." Two cities, Zurich (1.69) and Tokyo (1.54), score high enough to carry the report's actual "bubble risk" label. Dubai does not.
That distinction is the story UBS is telling, and it is worth reading properly rather than reducing to a single number. A city's score can rise on the back of a fast run of price growth even while its underlying affordability — what a buyer earns against what a home costs, what a landlord charges against what an owner pays — stays reasonable. UBS's own city profile and affordability charts for Dubai show exactly that pattern.
UBS's index is not a price index. It is a composite score built from five standardised sub-indices — price-to-income, price-to-rent, the change in mortgage debt relative to GDP, the change in construction activity relative to GDP, and (for most cities) the ratio of the city's price growth against its national market. In Singapore, Hong Kong and Dubai, that last component is replaced with an inflation-adjusted city price index, because none of the three has a meaningful "national" comparator.
The bands are fixed and public: low risk below 0.5, moderate 0.5 to 1.0, elevated 1.0 to 1.5, and bubble risk above 1.5 — measured in standard deviations from a city's own historical average. UBS is explicit that the framework does not predict whether or when a correction happens; the score measures the likelihood of one, built from how far prices, debt and construction have run from where fundamentals would put them.
The full top of the 2026 table, as UBS published it:
| Rank | City | Score | Band |
|---|---|---|---|
| 1 | Zurich | 1.69 | High (bubble risk) |
| 2 | Tokyo | 1.54 | High (bubble risk) |
| 3 | Miami | 1.41 | Elevated |
| 4 | Dubai | 1.16 | Elevated |
| 5 | Seoul | 1.13 | Elevated |
| 6 | Geneva | 1.12 | Elevated |
| 7 | Lisbon | 1.04 | Elevated |
| 8 | Amsterdam | 0.95 | Moderate |
| 9 | Madrid | 0.86 | Moderate |
Dubai's 2026 score of 1.16 is a rise from 1.09 in UBS's 2025 edition, where Dubai also placed fifth. The city has now sat in the elevated-risk band, not the bubble-risk band, in both editions.
UBS's own real-price and real-rent figures for the year to the second quarter of 2026 explain why the score moved so little given how much the market itself moved: real Dubai house prices are up just 0.4% year-on-year and real rents are down 4.0%. That is a market that has cooled sharply from the pace UBS records for 2025, when inflation-adjusted price growth exceeded 10%.
This is where UBS's own criteria do the arguing, not a broker's spin on them. Bubble risk in the UBS framework is not about being expensive — it is about being expensive relative to what local incomes and rents can support. On that measure, the cities carrying genuine bubble risk look nothing like Dubai.
UBS's price-to-income chart — the number of years a skilled service worker must work to buy a 60-square-metre apartment — puts Hong Kong at the top of the range at around 15 years and London at 11. Dubai sits at 5 years, among the most affordable of the 23 cities on this measure. Tokyo, Paris, London and Seoul all carry price-to-income ratios above 10.
The price-to-rent picture is the same shape. UBS records Zurich's ratio at 46 years of rent to buy an equivalent home, the highest of any city studied, with Geneva close behind. Dubai's ratio is 16 years. UBS also groups Dubai among the cities — alongside Madrid and Zurich, for different reasons — where the estimated cost of owning a home is currently below the cost of renting an equivalent one, which UBS says "makes homeownership relatively attractive compared with renting."
That is the honest version of the comparison the data supports: Zurich and Tokyo combine a high bubble-risk score with genuinely stretched affordability. Dubai combines an elevated score with affordability metrics that sit near the bottom of the range. The two are not measuring the same thing, and UBS's own chart labels make that explicit rather than requiring inference.
UBS's city profile for Dubai is direct about the driver, and it is momentum, not affordability. Its own words: "Following inflation-adjusted house price growth exceeding 10% in 2025, Dubai's housing boom came to an abrupt halt at the onset of the conflict involving Iran. Real house prices have fallen back to mid-2025 levels, while real rents are below their year-earlier level. Despite some easing since March, housing bubble risk remains elevated, according to the UBS Global Real Estate Bubble Index."
In other words, the sub-indices that moved Dubai's score — the pace of 2025's price run, and the mortgage-to-GDP and construction-to-GDP growth that came with it — reflect a boom that has already cooled by UBS's own account, measured through data collected to 26 August 2026. UBS also names the two risks it thinks could still weigh on Dubai from here: uncertainty over the pace at which high-income buyers return, and "persistent concerns about structural oversupply" from developments delivered later than planned.
An elevated score is not a reason to stay out; it is a reason to check what is actually driving it before acting on the headline. On Dubai, UBS names price momentum during 2025 that has since slowed to near flat — not a market where buyers are stretched against their income, or where owning costs more than renting. A market that ran hard and then paused, on fundamentals UBS itself rates as comparatively sound, reads differently to an investor than one where every underlying ratio is also at an extreme, which is the Zurich and Tokyo case.
We covered the wider capital-flow story behind that resilience in our piece on why the wealthy still choose the UAE, and the practical playbook for buying into a cooled Dubai market in our contrarian acquisition guide. Both are consistent with what this index shows: a market absorbing a shock without its price-to-income or price-to-rent fundamentals deteriorating.
Still reading
Need expert help on this subject?
Two things named directly in UBS's own report deserve equal weight. First, oversupply: UBS flags that stalled or delayed developments keep the market "exposed to heightened volatility due to persistent concerns about structural oversupply." Second, demand recovery is not guaranteed — UBS notes "uncertainty about a recovery of the inflow of high-income earners weighs on the premium segment." Either could move Dubai's score again in the 2027 edition, and neither is dismissed here.
- 1.16 — Dubai's UBS Global Real Estate Bubble Index score, 2026 edition (published 22 September 2026), rank 4 of 23 cities, band: elevated risk
- 1.09 — Dubai's score in the 2025 edition, rank 5 of 23
- 1.69 / 1.54 — Zurich / Tokyo, the only two cities in the 2026 "high risk" (bubble risk) band
- +0.4% / –4.0% — Dubai real price change / real rent change, year-on-year to Q2 2026 (UBS)
- 5 years — Dubai's price-to-income ratio (years of average skilled-worker income to buy a 60 sqm apartment), versus roughly 15 in Hong Kong and 11 in London
- 16 years — Dubai's price-to-rent ratio, versus 46 in Zurich and around 40 in Geneva
- 0.5 / 1.0 / 1.5 — the UBS band thresholds separating low, moderate, elevated and bubble risk
All figures above are as published by UBS in the Global Real Estate Bubble Index 2026 and 2025 editions.
Frequently asked questions
0401Is Dubai's property market a bubble, according to UBS?
No. UBS's 2026 index places Dubai property bubble risk at 1.16, in the "elevated risk" band. Only Zurich and Tokyo score high enough to be classed in UBS's actual "bubble risk" band this year.
02Why did Dubai's score rise between 2025 and 2026?
UBS attributes it to the pace of the 2025 price boom feeding into the mortgage-to-GDP and construction-to-GDP components, not to a deterioration in affordability. UBS's own commentary notes the boom "came to an abrupt halt" once the conflict involving Iran began, and that bubble risk "has eased since March" even though the annual score is higher than 2025's.
03Is Dubai housing overpriced relative to local incomes?
Not by UBS's own measure. UBS's price-to-income chart puts Dubai at around 5 years of a skilled worker's income to buy a 60 sqm apartment, near the affordable end of the 23 cities it studies, against roughly 15 years in Hong Kong.
04What could push Dubai into a higher risk band?
UBS names two factors: a slower-than-expected recovery in high-income buyer demand, and structural oversupply from developments delayed rather than cancelled.
Next step
Talk to Mitchells
Tell us what you are weighing up — a building, a project, an area, or a rule you need to get right — and we will come back with the specifics that apply to it.
Published 29 September 2026 by Stephen James Mitchell MBA. Market figures quoted reflect the data available at that date.